Chartsmade
Paste a table, get a chart that looks good, share it as a live embed.
Turns a table, a CSV or a sentence into a finished chart in your colours. Embed it, or download PNG or SVG.
Status: Live · product · built and run by Jack Stovell at Adapt Progress Evolve
What it is
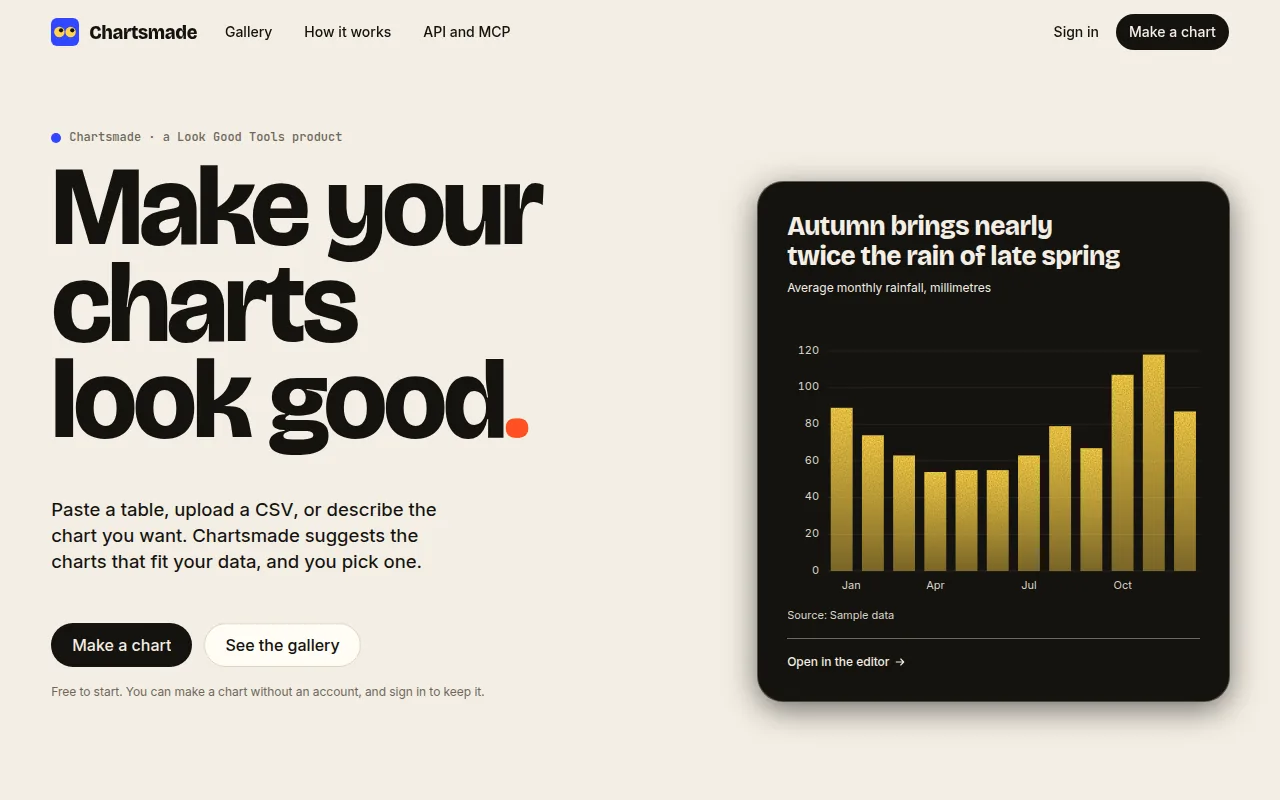
Chartsmade turns a table, a CSV or Excel file, a link to a CSV or published Google Sheet, or a sentence into a finished chart. Share it as a live embed that sizes itself, or download it as a PNG or SVG. It has a REST API and an MCP server, and is part of Look Good Tools.
Who it's for
Anyone who needs a clean chart in their own brand without wrestling a spreadsheet.
How it works
- Paste data. Bring a table, a file, a link or a description.
- Pick a suggestion. The editor shows what it read and suggests charts.
- Style and share. Set the theme and brand kit, then get a link, iframe or oEmbed URL, or download PNG or SVG.
Timeline
- — Launched
Facts
- Output
- Live embed, PNG, SVG
- Gallery
- 29 sample charts
- Free to start
- Yes
Under the hood
Stack: Cloudflare Workers.
FAQ
What is Chartsmade?
Chartsmade (chartsmade.com) makes finished charts from a table, a file or a description, in your colours and fonts.
Do I need an account?
No. Charts made without an account are kept for 30 days. A Look Good Tools account keeps them.
Can I use it from code or an AI assistant?
Yes. Chartsmade has a REST API and an MCP server.